Read and put in contextMarket and DOOHAttribution
DOOH attribution: what 71 percent more visits show
Nine DOOH campaigns in Norway, a peak of 71 percent more store visits. The source itself speaks of estimates, not proof of purchase. What such a figure supports and which questions to ask.
What happened
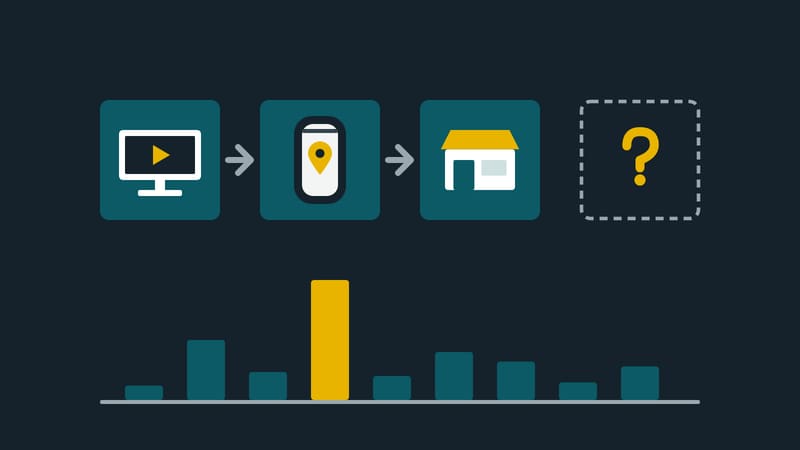
invidis reports on nine programmatic DOOH campaigns by Arla Foods in Norway in 2025, evaluated according to the source by Viooh. Spotzi and JCDecaux carried out footfall attribution studies for this: virtual geofences were placed around advertising sites and points of sale, and anonymised mobile network and location data was analysed. Counted were phones registered first near a screen and then, within a set period, mostly five days, at a point of sale. The visit figures were compared with the level before the campaign. The peak is 71 percent more store visits (Christmas campaign for Castello). Other campaigns are lower, for example 5 percent (Starbucks Tripleshot, March/April, about 145,000 additional visits) or 41 percent (the same brand in summer). Between ad contact and visit lay on average, per the source, less than two days. The source itself calls the values attribution estimates, not proof of purchase, and points to possible influence from season, special offers and parallel advertising.
The time span of less than two days is an average which the article attributes to the company Viooh. It says nothing about how many visits would have happened without the contact anyway.
What this means for screen operators
What the figure supports. The analysis shows that phones previously registered near an advertising site later appeared at a point of sale, and more often than before the campaign. That is a link in movement data, nothing more.
What it does not support. The source says so itself: these are estimates, not purchase receipts. A visit is not a purchase. And whether the screen triggered the visit cannot be read from the figure alone, because season and other measures may contribute. According to the source the comparison was with the level before the campaign. The article mentions no comparison group without ad contact, nor the sample size or the length of the comparison period. It speaks partly of more visitors, partly of more store visits; what exactly was counted remains open.
The editors' assessment. A peak is the best of nine values. The range from 5 to 71 percent shows that the result depends heavily on campaign and timing. Whoever passes on only the highest figure overstates.
Five questions for an attribution report that operators and advertisers can ask:
- Comparison. What is compared: a period before, an area without advertising, a group without contact?
- Sample. How many devices underlie the figure, and how is it extrapolated to the whole population?
- Location accuracy. How large are the geofences, and how far is confusion with passers-by who come by anyway excluded?
- Time window. How long may the gap between contact and visit be, and does the result change if the window is shorter?
- Parallel activity. Which other measures, offers and seasonal effects ran at the same time?
For network operators. Whoever passes on figures names source, period and method and says “indication of” rather than “proof of”. That saves later disputes with clients. How the data was lawfully collected is, as we read it, not stated in the source; this article is not legal advice.
This magazine is published by Kapaso GmbH, which develops software for such screens. The article describes general practice and refers to no product.